
Market research projects come in all shapes and sizes from surveys with 100 respondents to data mining projects with thousands, or even millions of records. Projects like these are conducted for many reasons, but there are consistent threads running through all of them. This post focuses on one of those threads, the concept of data cleaning.
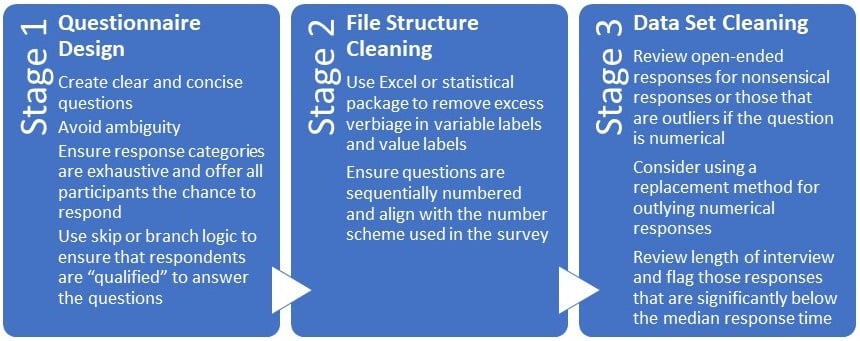
Stage One: Questionnaire Design
As a process, data cleaning actually begins well before the project has been fielded or the data extracted from a database. With survey research, the cleaning process begins with the design of the questionnaire. There are many ways to ask a respondent a question, but we as researchers need to focus on those ways that yield the least amount of bias. Questions that are written in a concise and objective manner, that a respondent can easily understand, will help to minimize error and the amount of subsequent data cleaning. At the questionnaire design stage, researchers should pay attention to:
- The type of questions used. Certain question types minimize bias when compared to a standard such as Likert scale question. They include constant sum, rank order, and semantic differentials. Consider these question types where appropriate.
- Make sure categories are as exhaustive as possible and include an “other please specify” option. All respondents should be able to answer the question via an appropriate answer choice, which could include “not applicable”. Make sure categories do not overlap, e.g. 20 – 29, 30 – 39, etc.
- Align your question types with your research agenda. If you are trying to estimate an average value via a multiple regression then you will need numeric data. Age, height, weight, salary, sales price, and market share are examples of variables that could be asked in an open numeric format. They could also be asked via a numeric ordered category, e.g. $15,000 – $19,999. If open numeric data is called for then expect to spend time replacing outliers and missing data with estimated values.
- Where appropriate, make use of branching logic. Respondents who are not qualified to answer a question set should not see the questions. Logic can be used to move them to the next question they are eligible to answer.
Once the data has been collected there are two additional stages of data cleaning. One is optional, but highly called for, and the second is mandatory. These two stages can be viewed as file structure cleaning and data set cleaning.
Stage 2: File Structure Cleaning
If you use an online survey platform then chances are you will want to engage in file structure cleaning. This step will not impact the results of any data analysis conducted, but it will impact the ease of understanding your reporting. When online survey platforms export data to Excel, a text format (CSV or .txt), or a statistical package such as SPSS or SAS, they frequently try to include as much of the question text as possible in the variable label field (or column header for text or Excel). Again, this will not impact your analysis, but it will impact the ease of reading banner tables or crosstabs. For example, a question in your survey may read:
How likely are you to recommend dining at Le Chateau Widget to your family, friends, or colleagues?
This is appropriate for the survey, but when reporting, it is much easier to replace the original question with:
Likelihood to Recommend
When programming your survey, it is recommended you employ consecutive question numbering, e.g. Q1, Q2…Q10a, Q10b, Q10c, etc. This is easier to do in some platforms than others, but it will make analysis and reporting easier. If your platform generates its own question numbers, then these can be changed to align with your questionnaire by using the search and replace function in Excel or SPSS. The search and replace process can be carried over to variable labels, and if necessary, value labels.
The goal of file structure cleaning is to keep things as simple and clean as possible. A guiding rule to consider is can a person understand your analysis output without a survey in hand? Your labels should give just enough detail to allow this but without extraneous elements.
Stage 3: Data Set Cleaning
Data set cleaning is mandatory. How much you will have to do depends upon the nature of your questionnaire and the caliber of your respondents. If your questionnaire has clear and concise questions with proper response categories and logic you will have less data to clean. If you have open-numeric questions, e.g. age or income, and/or did not use skip or branch logic there will likely be data to be cleaned.
If you employ open-ended questions as part of your quality control process then you may have to remove responses. You may see responses that include the common “abcdef” or other nonsensical responses. They can be flagged for removal. For example, in a project on behalf of a state lottery, an open-numeric question was asked to assess what dollar amount a respondent would consider to be a “win”. More than a few respondents indicated that a “win” in their mind would be over $2 billion. Outliers like this can be removed or recoded to values that are within a normal range. Methods for doing this are beyond the scope of this post but may be explored in future posts. This is typically more of a concern in consumer studies than in B2B. In the latter, the quality of their open-end responses should reflect greater awareness of the subject matter.
Other concerns the researcher should keep an eye on are length of interview and straight-lining in grid questions. Responses that are significantly below the median length of time should be reviewed for possible exclusion. These “speeders” may not have paid sufficient attention to the questions and their data may be suspect.
From a process perspective, data set cleaning can be accomplished via the following:
- Identify and remove speeders (identify the mean, or median, length of interview, and flag those that are significantly lesser than the average).
- Identify straight-liners (those that answer only one choice for a grid question, e.g. all “5s”).
- Review open-ended comments for gibberish responses. Remove those with responses that are nonsensical, profane, or way off-topic.
- Review the distributions of open numeric responses. Consider using methods such as mean or median replacement to adjust the outlying values. Do not replace the original variable, instead work with a copy.
In conclusion, data cleaning is something analysts should budget time for in their research plans. If the goal is to deliver insights that can be used for decision making it is on our onus to ensure the data set is clear of suspect responses. The amount of time needed for data cleaning is a function of the work we put into our questionnaire design and the quality control measures we put into place.